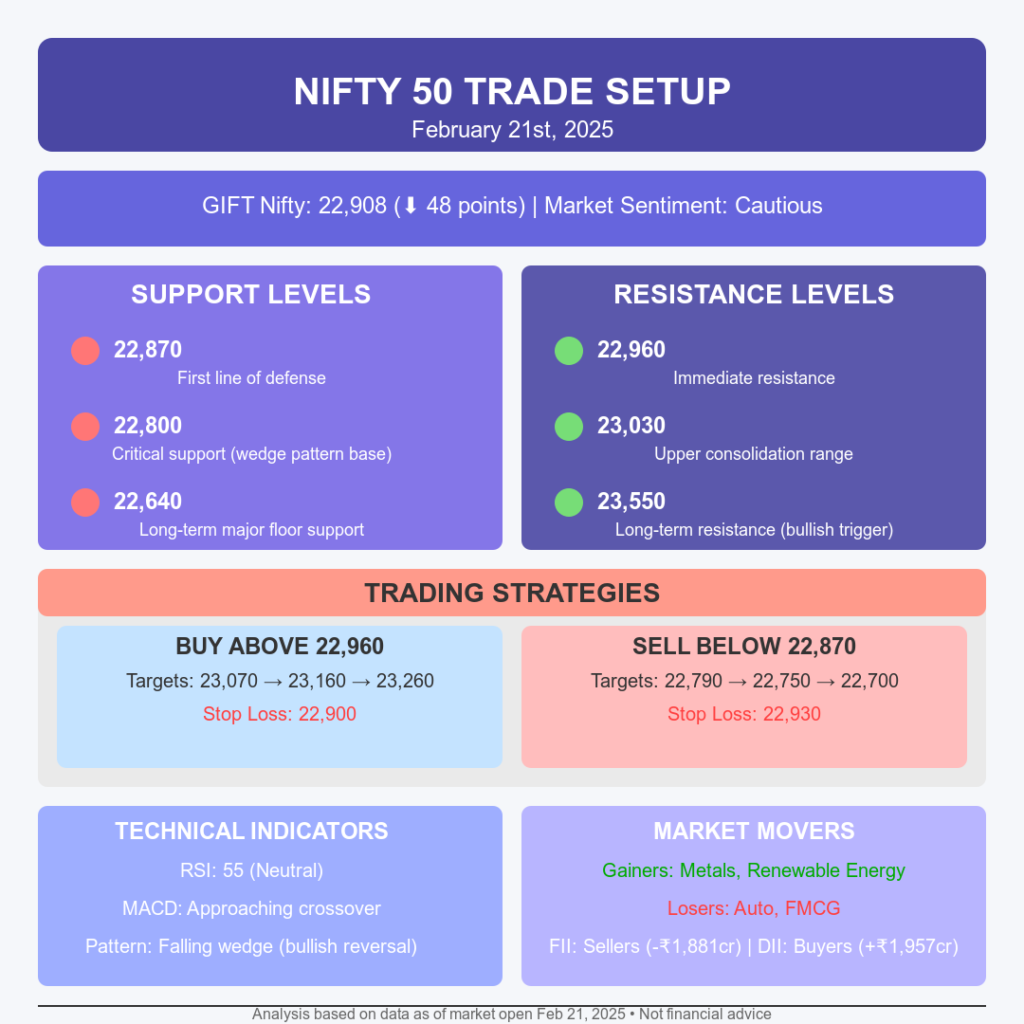
Nifty 50 Trade Setup for February 21st: The Nifty 50 opened on a flat-to-negative note on February 21st, reflecting cautious sentiment amid global uncertainties and mixed domestic cues. As of the latest data, Gift Nifty was trading at 22,908, down 48 points, indicating a bearish undertone. This article provides a detailed breakdown of key levels, market drivers, and actionable strategies for traders and investors.
Nifty 50 Trade Setup for February 21st: Key Levels to Watch: Support and Resistance
Support Levels:
- 22,870 – The first line of defense, below which selling pressure could intensify.
- 22,800 – A critical support zone aligned with the falling wedge pattern base.
- 22,640 – Long-term support that could act as a major floor in case of significant corrections.
Resistance Levels:
- 22,960 – Immediate resistance; a breakout above this could trigger intraday bullish momentum.
- 23,030 – The upper boundary of the recent consolidation range.
- 23,550 – Long-term resistance, crossing which could indicate the beginning of a bullish phase.
Technical Outlook: Short-Term and Long-Term Analysis
Short-Term Technicals
On the 15-minute chart, Nifty is trading within a tight consolidation range of 22,800–23,030. The index’s inability to close above 23,030 in the last session highlights a lack of buying momentum.
- Indicators to Watch:
- RSI (Relative Strength Index): Currently at 55, suggesting neutral momentum.
- MACD (Moving Average Convergence Divergence): Approaching a potential crossover, indicating a possible short-term move.
Intraday Strategy:
- Buy Above: 22,960 with targets of 23,070, 23,160, and 23,260. Stop-loss: 22,900.
- Sell Below: 22,870 with targets of 22,790, 22,750, and 22,700. Stop-loss: 22,930.
Long-Term Technicals
On the 4-hour chart, Nifty is forming a falling wedge pattern, which is generally a bullish reversal structure. However, a decisive breakout above the 23,550 level is needed to confirm long-term bullishness.
- Support Zone: 22,800–22,830 (wedge base).
- Breakout Level: 23,550–23,600.
Factors Driving Market Sentiment
1. Global Market Weakness
- The Trump administration’s new tariffs on automobiles, semiconductors, and pharmaceuticals have increased global trade tensions.
- Asian markets, including Nikkei 225 and Hang Seng, traded lower, reflecting investor caution.
2. FII and DII Activity
- FIIs: Net sellers of ₹1,881 crore in the last session, continuing their cautious stance.
- DIIs: Net buyers of ₹1,957 crore, providing support and balancing out FII selling.
Sectoral Performance: Movers and Shakers
Top Gainers:
- Metals: Resilient amid global uncertainties, with stocks like Tata Steel and Hindalco posting gains.
- Renewable Energy: Stocks like Waaree Energies gained on new solar project orders.
Top Losers:
- Auto: Hit by Trump’s tariffs, with Maruti and Tata Motors facing selling pressure.
- FMCG: Profit booking in heavyweights like Hindustan Unilever dragged the sector lower.
Actionable Tips for Traders
- Use Pivot Points: Identify intraday support and resistance levels using pivot point calculations.
- Track FII/DII Data: Monitor institutional activity to gauge market sentiment.
- Set Stop-Loss Levels: Protect your trades by adhering to predefined stop-loss levels.
FAQs: Nifty 50 Trade Setup for February 21st
1. What is the significance of the 22,800 support level for Nifty 50?
This level aligns with the base of the falling wedge pattern and represents a critical area where buyers could emerge.
2. Why is the market facing selling pressure despite positive domestic cues?
Global factors like trade tensions and FII selling are overshadowing domestic positives, such as DII buying and economic recovery signals.
3. What sectors are likely to perform well in this market?
Metals and renewable energy stocks show resilience and could outperform in the short term.
4. Should I buy or sell Nifty 50 today?
Consider buying above 22,960 or selling below 22,870, depending on market movement and risk appetite.
You might also like to read: The Hidden Psychology Behind Your Money Mistakes
Disclaimer: The information provided in this article is for educational and informational purposes only and should not be considered as financial advice. Market investments are subject to risks, including the risk of principal loss. Before making any investment decisions, consult with a certified financial advisor and conduct your own research. Past performance is not indicative of future results. The author and publisher are not responsible for any financial losses or damages resulting from the use of this information. Always trade responsibly and with proper risk management.
Visual Recap: Nifty 50 Trade Setup for February 21st


