Trade Setup for March 21: As the Indian stock markets continue their strong momentum, traders and investors are eyeing the next levels of resistance and support for Nifty 50 and Bank Nifty. The market gained over 1% on March 20, fueled by a broad-based rally across sectors and a decline in India VIX, signaling increased confidence among investors.
Experts suggest that Nifty is likely to continue its upward march toward 23,400, which aligns with the 100-day and 200-day Exponential Moving Averages (EMAs) and the 78.6% Fibonacci retracement level (from 23,807 to 21,965). However, after an 860-point surge in the last four sessions, some consolidation is also possible, with 23,100-23,000 acting as an immediate support zone.
Let’s dive into the detailed trade setup for March 21, covering Nifty, Bank Nifty, options data, and other key market indicators.
Trade Setup for March 21
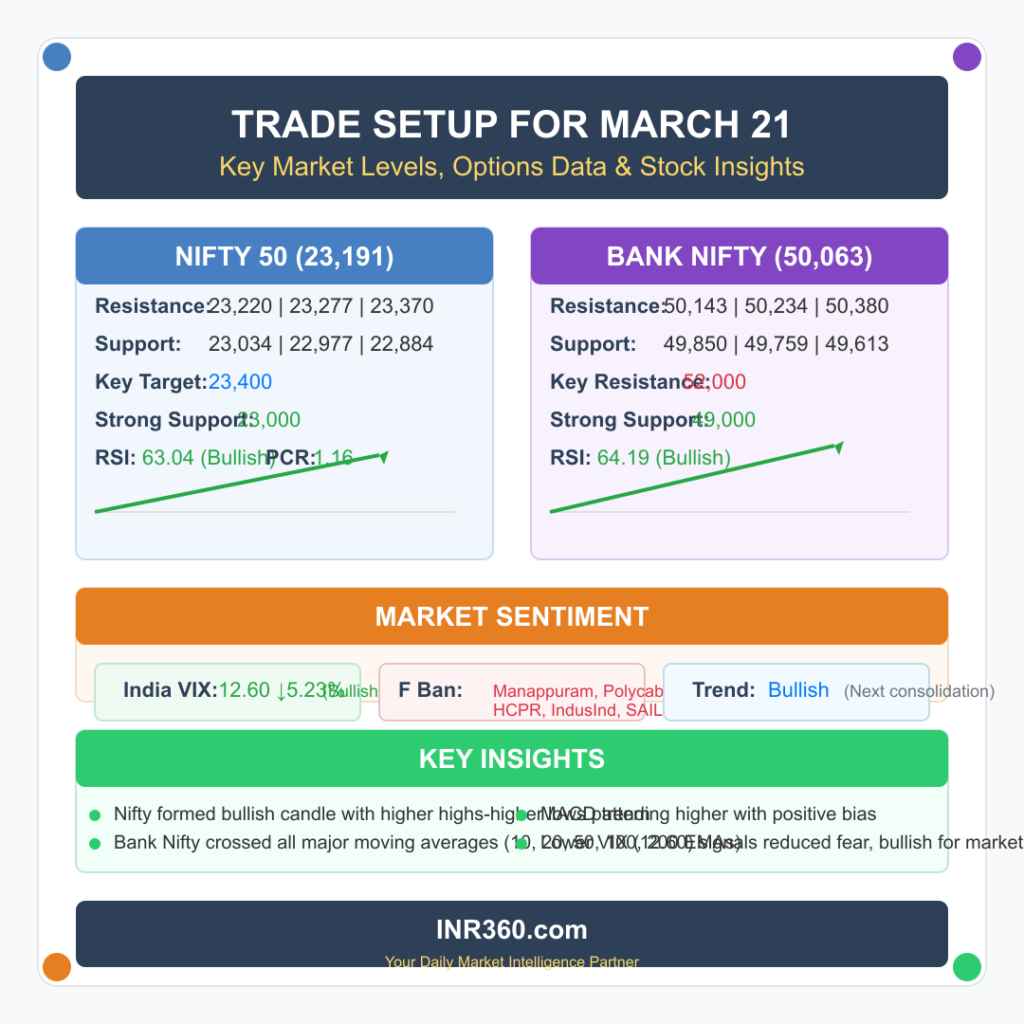
1) Nifty 50 Key Levels (23,191)
| Levels | Key Figures |
|---|---|
| Resistance Levels (Pivot Points) | 23,220, 23,277, 23,370 |
| Support Levels (Pivot Points) | 23,034, 22,977, 22,884 |
Special Formation
- The Nifty 50 formed a long bullish candle on the daily charts with above-average volumes, continuing its higher highs-higher lows formation for the third consecutive session.
- The index closed above the short- to medium-term moving averages, a positive indicator.
- Momentum indicators:
- RSI (Relative Strength Index) rose to 63.04, signaling bullish strength.
- MACD (Moving Average Convergence Divergence) is trending higher with a positive bias (though still below the zero line).
2) Bank Nifty Key Levels (50,063)
| Levels | Key Figures |
|---|---|
| Resistance Levels (Pivot Points) | 50,143, 50,234, 50,380 |
| Support Levels (Pivot Points) | 49,850, 49,759, 49,613 |
| Resistance (Fibonacci Retracement) | 50,287, 51,085 |
| Support (Fibonacci Retracement) | 49,284, 47,872 |
Special Formation
- Bank Nifty entered a strong uptrend after surpassing all major moving averages (10, 20, 50, 100, and 200-day EMAs).
- The index gained 360 points and formed a bullish candlestick pattern with a sizeable lower shadow, indicating buying interest at lower levels.
- Momentum indicators:
- RSI at 64.19, signaling bullish strength.
- MACD trending higher, moving closer to the zero line, indicating a positive bias.
3) Nifty Call Options Data
| Strike Price | Max Call OI (Contracts) | Max Call Writing (Contracts) |
|---|---|---|
| 24,000 | 1.05 crore | 47.58 lakh |
| 23,500 | 77.63 lakh | 42.18 lakh |
| 23,000 | 75.38 lakh | 38.47 lakh |
🔹 Key takeaway: 24,000 is the strongest resistance level for Nifty in the short term.
4) Nifty Put Options Data
| Strike Price | Max Put OI (Contracts) | Max Put Writing (Contracts) |
|---|---|---|
| 23,000 | 92.88 lakh | 57.3 lakh |
| 22,500 | 88.17 lakh | 41.97 lakh |
| 22,800 | 69.13 lakh | 37.59 lakh |
🔹 Key takeaway: 23,000 is a strong support level for Nifty.
5) Bank Nifty Call Options Data
| Strike Price | Max Call OI (Contracts) | Max Call Writing (Contracts) |
|---|---|---|
| 52,000 | 16.46 lakh | 2.22 lakh |
| 51,000 | 14.64 lakh | 1.62 lakh |
| 50,000 | 13.43 lakh | 1.59 lakh |
🔹 Key takeaway: 52,000 is the major resistance level for Bank Nifty.
6) Bank Nifty Put Options Data
| Strike Price | Max Put OI (Contracts) | Max Put Writing (Contracts) |
|---|---|---|
| 49,000 | 21.93 lakh | 5.78 lakh |
| 48,000 | 19.77 lakh | 2.14 lakh |
| 48,500 | 14.03 lakh | 1.88 lakh |
🔹 Key takeaway: 49,000 is a strong support level for Bank Nifty.
7) Market Sentiment Indicators
Put-Call Ratio (PCR)
- Nifty PCR dropped to 1.16 (from 1.2 in the previous session).
- A PCR above 1 suggests bullish sentiment, while a drop below 0.7 indicates bearishness.
India VIX (Volatility Index)
- India VIX fell 5.23% to 12.60, the lowest closing level since October 2024.
- A declining VIX indicates reduced fear, which is bullish for the market.
8) Stock-Specific Insights
Long Build-up (71 Stocks)
📈 Stocks showing bullish trends with increasing open interest (OI) and price
Long Unwinding (20 Stocks)
📉 Stocks seeing price declines with a decrease in OI
Short Build-up (42 Stocks)
🔻 Stocks where OI is increasing with price decline, indicating fresh shorts
Short Covering (84 Stocks)
📊 Stocks experiencing rising prices with decreasing OI, signaling short covering
9) High Delivery Trades
- Stocks with a high share of delivery indicate investor confidence rather than speculative trading.
10) Stocks Under F&O Ban
| Status | Stocks |
|---|---|
| New Additions | Manappuram Finance, Polycab India |
| Retained | Hindustan Copper, IndusInd Bank, SAIL |
| Removed | None |
Trade Setup for March 21
🔹 The Nifty 50 remains bullish, with 23,400 as the next key target, though consolidation could occur.
🔹 23,000 remains a strong support, while 24,000 acts as the major resistance in the options chain.
🔹 Bank Nifty remains in a strong uptrend, with 49,000 as support and 52,000 as resistance.
🔹 Declining India VIX and a healthy Put-Call Ratio indicate a favorable setup for bulls.
Traders should keep an eye on global cues, FII activity, and sectoral performance to fine-tune their strategies.
What’s your trading plan for March 21? Let us know in the comments! 🚀📊
You Might Also Like to Read: Trade Setup for March 19: Will Nifty 50 Hold Its Momentum or Consolidate?
This Trade Setup for March 21 is for educational purposes and not meant for trading.
Visual Recap: Trade Setup for March 21


